“Sell in May and go away”1 is probably the most widely cited stock market cliché in history. Every year a barrage of Wall Street commentaries, media stories, and investor questions flood in about the popular stock market adage. We tackle this commonly cited seasonal pattern and why some seasonal weakness could make sense in 2021.
The Worst Six Months of the Year
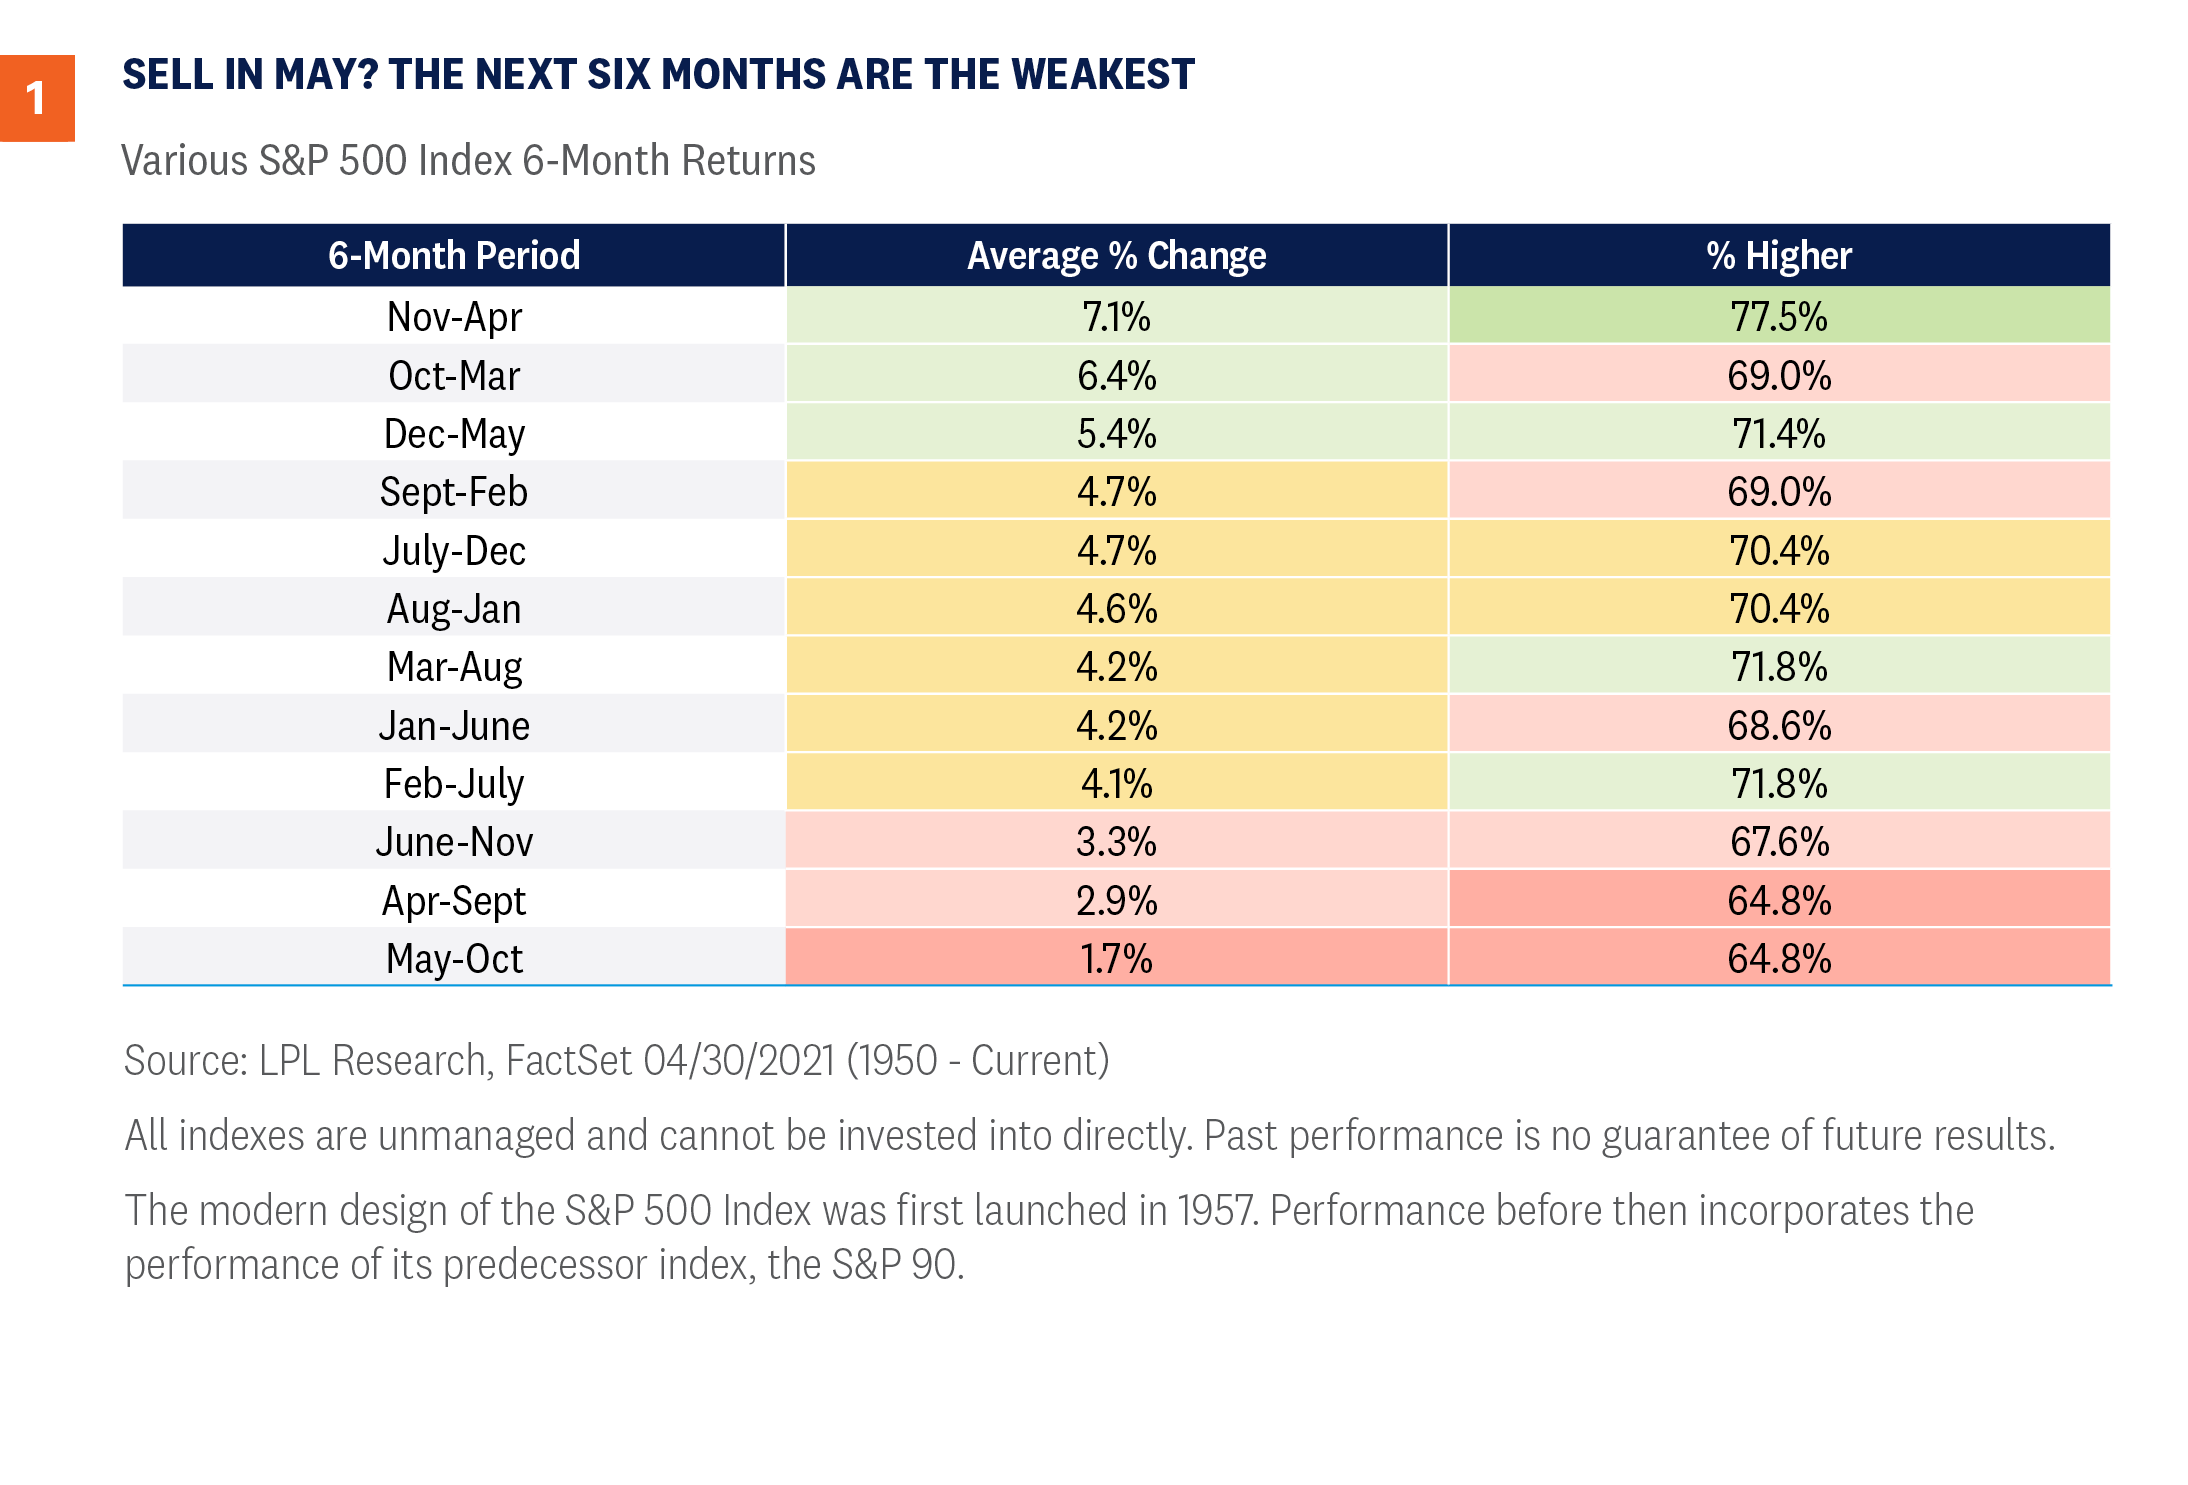
“Sell in May and go away” is the seasonal stock market pattern in which the six months from May through October are historically weak for stocks, with many investors believing that it’s better to avoid the market altogether by selling in May and moving to cash during the summer months.
As [Figure 1] shows, since 1950 the S&P 500 Index has gained 1.7% on average during these six months, compared with 7.1% during the November to April period. In fact, out of all six-month combinations, the May through October period has produced the weakest—and least positive—average return.
With the S&P 500 up 87% from the March 2020 lows, we do think the potential for some seasonal weakness is high and would be perfectly normal after such a run.
What Have You Done for Me Lately?
As we head into this seasonally weak period, keep a few things in mind. First, the S&P 500 has closed higher during the month of May in seven of the past eight years—so “Sell in June” might be more appropriate. In addition, stocks appear to get a boost in May of a post-election year, as the S&P 500 is up 1.7% on average these years, with only July and November stronger.
The point is that investors shouldn’t necessarily blindly sell on May 1, but rather should be aware that volatility tends to happen in the summer and fall months. As we mentioned in our April 19, 2021 issue Peak Optimism?, we do see some signs that the bar is quite high now for further upside market catalysts. Everyone knows the reopening is happening, and everyone knows the economy is roaring back. From a contrarian point of view, this high bar could be tougher to clear as we move into the seasonally weaker summer and fall months.
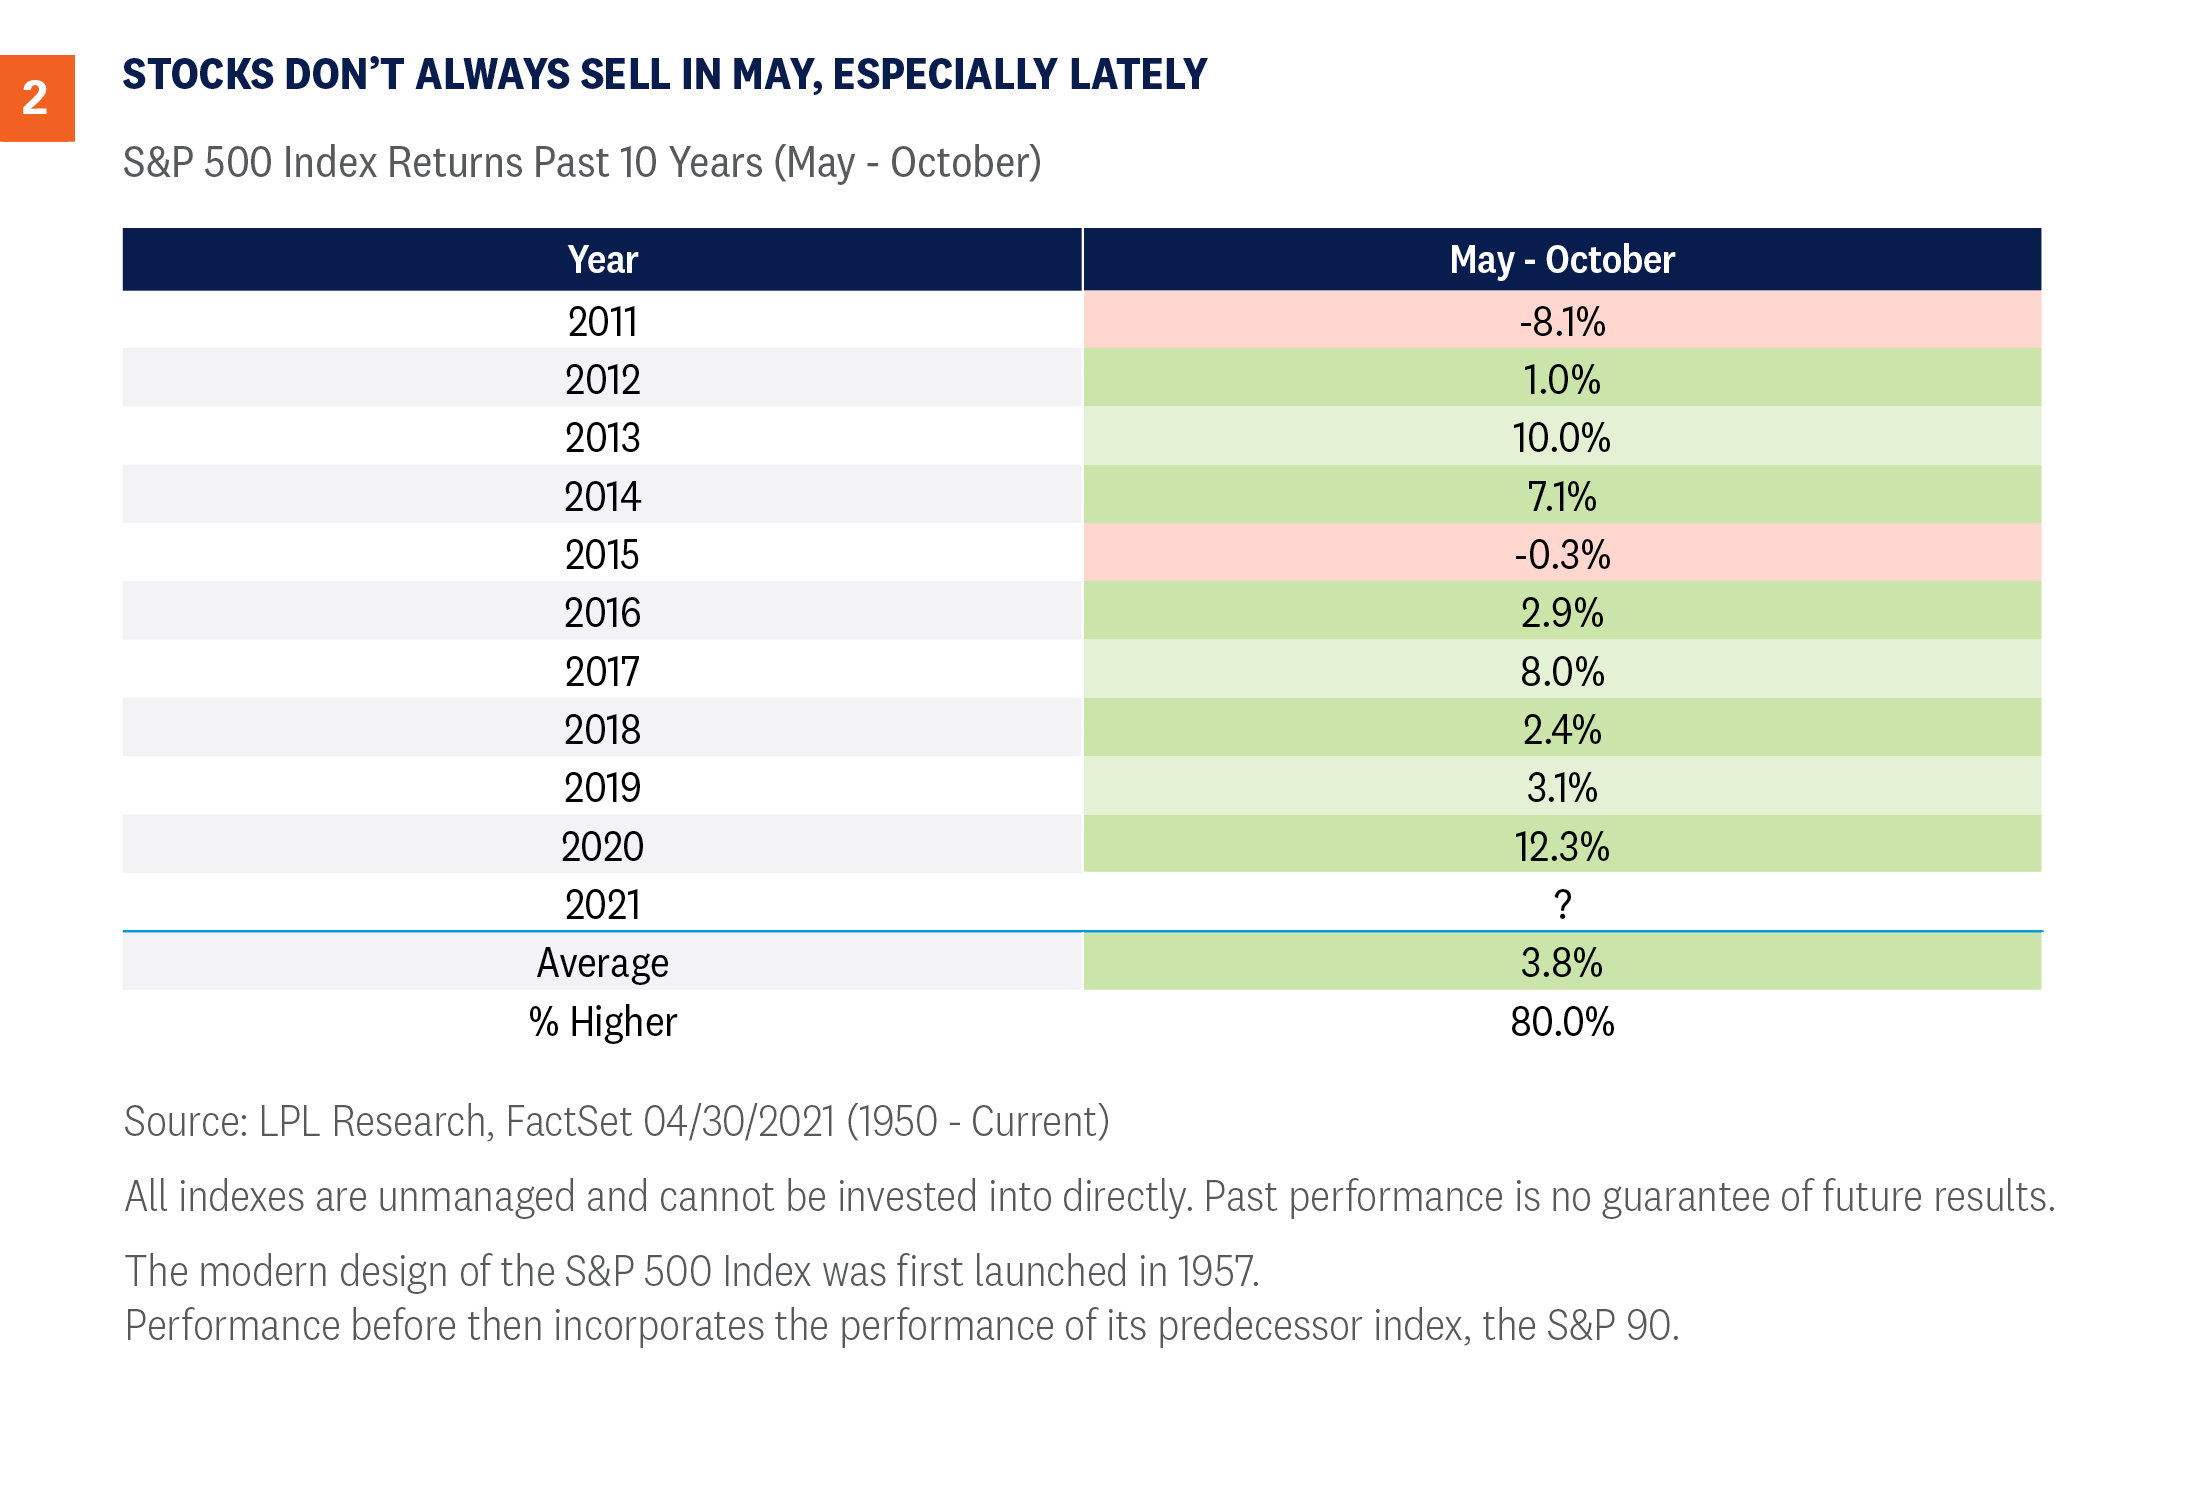
Here’s the catch—and there’s always a catch: These ‘worst six months of the year’ have been quite strong lately. In fact, stocks gained eight of the past 10 years during these six months, as you can see in [Figure 2]. So, although our guard is up for some potential seasonal weakness, be aware it could be short-lived, and we’d use it as a buying opportunity.
Four Other Looks at the Next Six Months
Let’s take a deeper dive into these ‘worst six months of the year’:
- When April is up more than 5%, like it was this year, the next six months are up 6.2% on average—well above the 1.7% average during these six months.
- Post-election years average 2.4% during these worst six months.
- The best six months of the year just ended, and they gained nearly 28% this time around. It appears that big gains during these months can eat away at future returns. In fact, the next six months are up only 0.7% on average when the previous six months are up at least 20%.
- When the S&P 500 closes at a new monthly high in April, like it did this year, the next six months do much better, up 5.6%.
Putting it all together, the only other year in history to close April at a new monthly high, be up at least 20% during the previous six months, and do it all in a post-election year was in 1961. What happened the next six months? The S&P 500 gained a very respectable 5.1%.
Conclusion
The media will have fun with the whole “Sell in May” warning to drive up clicks and views. Although you can’t argue that these months historically have been weak, they still sport a positive return, so totally going away isn’t wise. Recently we’ve been noting some potential reasons for at least a pause in the rally, and now the calendar adds another.
But amid a backdrop of an improving economy, massive levels of fiscal and monetary stimulus, and rising vaccination rates, we don’t expect any pullbacks to last very long, and we’d use any that appear as a buying opportunity. While we upgraded our forecast for the global economy and U.S. corporate earnings last month, for now we are maintaining our fair value target range for the S&P 500 of 4,050–4,100. At the same time, we acknowledge the environment appears supportive for stocks to do better, and we continue to recommend an overweight-to-equities and underweight-to-fixed-income position relative to investors’ targets, as appropriate.
Read previous editions of Weekly Market Commentary on lpl.com at News & Media.
1 “Sell in May and go away” began in England originally as “sell in May and go away until St. Leger’s Day.” The saying was based around the St. Leger Stakes, a popular horse race in September that marked the end of summer and a return of the big traders and market volume.
IMPORTANT DISCLOSURES
This material is for general information only and is not intended to provide specific advice or recommendations for any individual. There is no assurance that the views or strategies discussed are suitable for all investors or will yield positive outcomes. Investing involves risks including possible loss of principal. Any economic forecasts set forth may not develop as predicted and are subject to change.
References to markets, asset classes, and sectors are generally regarding the corresponding market index. Indexes are unmanaged statistical composites and cannot be invested into directly. Index performance is not indicative of the performance of any investment and do not reflect fees, expenses, or sales charges. All performance referenced is historical and is no guarantee of future results.
Any company names noted herein are for educational purposes only and not an indication of trading intent or a solicitation of their products or services. LPL Financial doesn’t provide research on individual equities.
All information is believed to be from reliable sources; however, LPL Financial makes no representation as to its completeness or accuracy.
US Treasuries may be considered “safe haven” investments but do carry some degree of risk including interest rate, credit, and market risk. Bonds are subject to market and interest rate risk if sold prior to maturity. Bond values will decline as interest rates rise and bonds are subject to availability and change in price.
The Standard & Poor’s 500 Index (S&P500) is a capitalization-weighted index of 500 stocks designed to measure performance of the broad domestic economy through changes in the aggregate market value of 500 stocks representing all major industries.
The PE ratio (price-to-earnings ratio) is a measure of the price paid for a share relative to the annual net income or profit earned by the firm per share. It is a financial ratio used for valuation: a higher PE ratio means that investors are paying more for each unit of net income, so the stock is more expensive compared to one with lower PE ratio.
Earnings per share (EPS) is the portion of a company’s profit allocated to each outstanding share of common stock. EPS serves as an indicator of a company’s profitability. Earnings per share is generally considered to be the single most important variable in determining a share’s price. It is also a major component used to calculate the price-to-earnings valuation ratio.
All index data from FactSet.
Please read the full Outlook 2021: Powering Forward publication for additional description and disclosure.
This research material has been prepared by LPL Financial LLC.
Securities and advisory services offered through LPL Financial (LPL), a registered investment advisor and broker-dealer (member FINRA/SIPC). Insurance products are offered through LPL or its licensed affiliates. To the extent you are receiving investment advice from a separately registered independent investment advisor that is not an LPL affiliate, please note LPL makes no representation with respect to such entity.
| Not Insured by FDIC/NCUA or Any Other Government Agency | Not Bank/Credit Union Guaranteed | Not Bank/Credit Union Deposits or Obligations | May Lose Value |
RES-733201-0421 | For Public Use | Tracking # 1-05139454 (Exp. 05/22)