Use of the terms “bull” and “bear” in financial markets can be traced back to London’s financial district in the late 19th century, used as an analogy for how each animal attacks; the bull thrusts its horns upwards, and a bear swipes its paws downwards. Others believe the terms started in the 16th century when bearskin salesmen would sell skins they had yet to receive from trappers, hoping the price from trappers would drop. We’ll leave that debate to you. On Wall Street today, firms consider a base case, or what they believe will likely occur, and bull and bear cases of factors that could sway markets in either direction. As our base case, we expect moderate gains for stocks, rangebound Treasury yields, and slight cooling in the economy. But as the recent spike in volatility and subsequent rebound has illustrated, nothing in capital markets is a sure thing.
Our better-than-expected, or bull case, would feature an extension of strong artificial intelligence (AI) driven earnings growth and investment boosting productivity, a strong economy without recession, lower interest rates as inflation comes down further, supportive policies from Washington, and continued positive technical trends.
Double-Digit Earnings Growth Expected in 2024
Expected continued steady economic growth should enable corporate America to grow profits at or near a double digit pace in 2025. More than 60% through fourth quarter earnings season, earnings growth for the S&P 500 is tracking to a very strong and better-than-expected 16% pace, and companies have generally offered upbeat outlooks, resulting in the normal amount of estimate cuts. Consensus analysts’ estimates for S&P 500 earnings in 2025 still imply a 13% increase even after the reduction since New Year’s (LPL Research expects something closer to 9–10% — still solid growth).
Factors driving these earnings gains include solid economic growth, massive AI investment, related increases in productivity, which boost margins, and deregulation, particularly for financial and energy companies. Tariffs will offset some of these positive earnings drivers, though to what degree is an open question.
Strong Earnings Growth Underpins the Bull Case for Stocks in 2025
Big jump in earnings growth in Q4 with more double-digit gains likely ahead
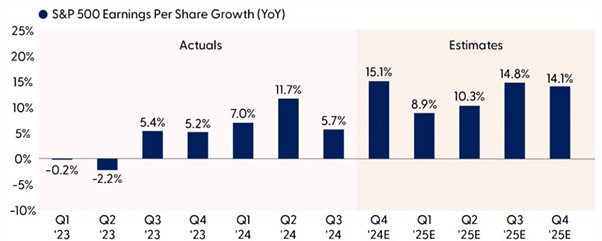
Source: LPL Research, Bloomberg, 02/06/25
Disclosures: All indexes are unmanaged and cannot be invested in directly. Past performance is no guarantee of future results. Estimates may not develop as predicted.
Robust Economic Growth, Fueled by Business Spending and Moderating Inflation
It’s easy to forget the U.S. just experienced one of the most aggressive rate-hiking cycles in history, and now, the Federal Reserve (Fed) is well into its rate-cutting campaign — and the economy not only remained intact, but performed well. A bull case for the economy would be driven by robust economic growth stemming from a few areas. Conditions are ripe for more business investment, and there is a sizable amount of capital ready to be deployed for expansion and research and development. On the inflation front, sticky services inflation has slowed disinflation progress, but services prices are poised to moderate this spring. Further, though the situation is fluid, tariffs and trade sanctions might be softer than feared, which could remove the overhang of inflationary and gross domestic product (GDP) headwinds from stout universal levies.
Stable Rates Are Likely, but the Treasury Could Aid Rate Relief
After a sizable move higher to start the month, Treasury yields have moved lower since the turn of the calendar. With the Fed signaling fewer rate cuts than initially expected through a slower, and potentially shallower, rate cutting cycle and a positive term premium, yields will likely remain stable. For the sake of the bull case scenario, yields could feel some downside pressure from moderating inflation, barring any negative economic surprises, of course. But the key would be monitoring the balance between growth risks (yields lower) and inflation risks (yields higher) in any new tariff regime. In the near term, the reemergence of the debt ceiling debate and the subsequent lack of new Treasury issuance until March, could be a marginal tailwind to rates. Moreover, recent comments by the new Treasury Secretary, Scott Bessent, and the desire from the Trump administration for lower 10-year yields through lower energy prices and spending cuts could keep rates well bid. Finally, at last week’s Treasury Quarterly Refunding Announcement, the Treasury Department noted that Treasury issuance trends would remain centered on shorter-maturity T-Bills (and not longer-maturity coupons), which could also provide rate relief as coupon supply remains steady amid still solid demand.
Potential Tax Cuts Are Bullish, but Difficult to Achieve
Some of the market’s advance since the November election can be attributed to market enthusiasm over tax cuts. While we put extending the Trump tax cuts from 2017 firmly in the bullish column, especially considering some new tax cuts may be added, e.g., a higher cap on mortgage interest deductions for state and local taxes (so-called SALT) and eliminating taxes on tips, overtime, and Social Security.
These extensions are by no means a slam-dunk. The tax cuts will be difficult to achieve because offsetting spending cuts and additional revenue will be needed to get them through Congress. If only a portion of the more than $4 trillion in tax cuts from the Tax Cuts and Jobs Act of 2017 are extended, taxes will effectively increase in 2026. We expect most of the cuts to be extended, but they may expire in five years to lower the cost, and markets could be disappointed with how negotiations play out later this year.
The Bull Market Has Plenty of Room Left to Run
Recent developments in technology (DeepSeek) and headline tariff risk have rattled markets, but, despite near-term risks, we believe investors should give the bull market the benefit of the doubt. After all, since 1950, the average bull market tends to last over five years, and this bull just turned two last October. Plus, it’s hard to dispute the bullish momentum in the broader market. The S&P 500’s impressive 23.3% gain in 2024 carried over into January. Despite a slow start, the index rebounded to achieve a 2.7% gain last month, and historically, a positive January has been a bullish indicator for stocks. Yale Hirsch, the creator of the “Stock Trader’s Almanac,” identified this pattern in 1972, calling it the January Barometer with the famous tagline, “As goes January, so goes the year.” Hirsch’s adage has stood the test of time, making the January Barometer one of the most popular and respected seasonal indicators. Since 1950, the S&P 500 has averaged an annual return of 17% in years with a positive January, with 89% of those years also ending positively. Additionally, the index has averaged February–December returns of 12.2%, with 86% of those periods ending in positive territory. Conversely, when the S&P 500 declined in January, annual returns averaged -1.7%, with only 50% of those years ending positively.
January Barometer and S&P 500 Performance (%)
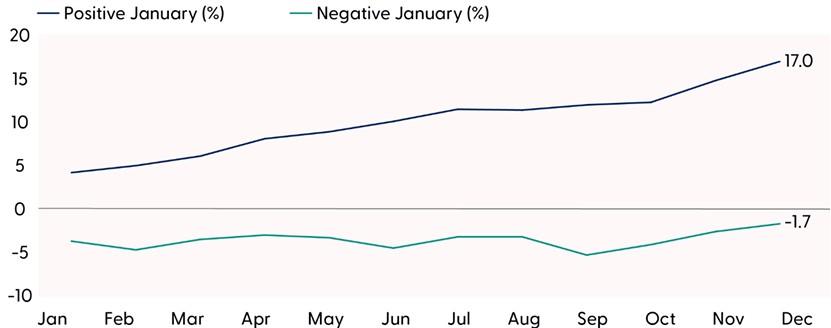
Source: LPL Research, Bloomberg, 02/06/25
Performance based on the 1950–2024 period. Disclosures: All indexes are unmanaged and cannot be invested in directly. Past performance is no guarantee of future results. The modern design of the S&P 500 stock index was first launched in 1957. Performance back to 1950 incorporates the performance of the predecessor index, the S&P 90.
Our bear case, or worse-than-expected scenario, features escalating trade tensions, unabated deficit spending, another uptick in inflation coupled with no additional rate cuts from the Fed, excessive bullish sentiment, and elevated equity valuations.
Tariffs Could Weigh on Economic Growth and Multinational Profits
Tariffs may help reach objectives, such as raising much-needed revenue for the U.S. Treasury or encouraging stronger border enforcement by Mexico. But they hurt corporate profits by increasing import costs. And if countries retaliate, as China has (and as Canada and Mexico have planned), economic growth would be impaired. Tariffs also tend to push the U.S. dollar higher, which is a drag on profits for multinationals, and can cause inflation, even if temporary.
We consider tariffs part of the bear case primarily because of China, where tariffs are likely to persist and potentially be ratcheted higher. Tariffs are likely to be small, narrow, and potentially short-lived in Canada and Mexico, if they are put on at all, while the Trump administration is likely to impose tariffs on Europe in the coming months.
Deficit Spending Paired with Tariffs Could Be Tricky for Bonds
While economic growth will remain a key driver of interest rates, a secondary risk to rates remains the amount of Treasury debt needed to fill federal budget deficits. The Trump administration will likely keep the deficit unchanged, but expansion of the deficit is a possibility. The Congressional Budget Office (CBO) forecast likely underestimated budget deficits going forward given they assumed no new spending initiatives nor an extension of the Tax Cuts and Jobs Act, which will likely be extended by the Trump administration (at least mostly). The Treasury Department will need to issue and find investors for trillions more in Treasury securities to fill budget deficits, and to roll over Treasury securities set to mature in 2025. Moreover, related to the Trump presidency, there is a concern that deficit spending and tariffs could help growth but also keep inflationary pressures elevated. Tariffs could initially drive a lower trading range for rates through safe-haven flows, but any significant escalation could eventually push yields higher if tariffs prove inflationary, supply chains re-shore, and/or China reduces Treasury holdings more aggressively – as was the case during the first Trump administration.
A Pickup in Inflation Would Be a Headwind
While businesses are ramping up capital expenditures to boost productivity, cushioning the economy, a rise in inflation is not fully off the table. Consumers continue to feel good about current economic conditions and are putting their hard-earned dollars to good use. But if retail spending and personal incomes continue to rise, inflation could remain elevated and run hotter than expected. Energy prices are stripped out of core inflation metrics, the Fed’s preferred gauges, but energy prices contributed over 40% of the monthly increase in headline inflation in December. Inflationary pressures could emerge if a geopolitical shock drives oil prices higher, or if President Trump’s hopes of lowering crude prices fall through. A pickup in inflation would also create some turbulence for the Fed, pushing out or even eliminating additional rate cuts in 2025, which could spark volatility in markets.
Inflation Expectations Have Been Inching Higher
The Fed wants inflation at 2.5% or lower, not 3%
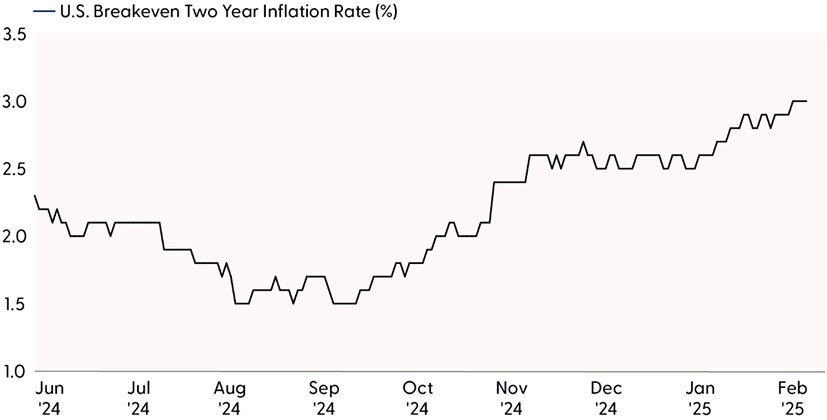
Source: LPL Research, Bloomberg 02/05/25
Disclosures: All indexes are unmanaged and cannot be invested in directly. Past performance is no guarantee of future results. Breakeven inflation rates represent market expectations for future inflation over a given time frame based on the difference between a nominal Treasury yield and a Treasury Inflation-Protected Security (TIPS) yield of the same duration.
Sentiment Has Eased, but Remains Stretched
Coming into 2025, consumer sentiment towards the stock market was near all-time highs. Bullish views on the stock market for 2025 have eased some since December but remain above the previous all-time highs. When measures of bullishness or complacency get too stretched, they can be precursors to market selloffs. Put/call ratios (measuring the number of puts, or right to sell, divided by the number of calls, or right to buy, for an investment), are another gauge of market sentiment and remain near lows. While low put/call ratios may indicate less concern over a stock market decline and can precede stock market rallies, from a contrarian perspective, the lack of fear and a high degree of investor complacency could be a bearish indicator. Current ratios sit near November 2018 levels, before the market shed 9% and erased year-to-date gains. If bullish sentiment experiences a resurgence and becomes further stretched, markets may become a little more wary of overexuberance and vulnerable toward a sell-off.
A Lot of Good News Is Priced in With Valuations Elevated
We write and say it over and over – valuations are not good timing tools. But when the stock market gets a reason to drop, those declines tend to be bigger when they are accompanied by lofty valuation metrics. On a price-to earnings ratio (P/E) basis using the analysts’ consensus earnings estimates for the next 12 months, the S&P 500 is trading at a P/E over 22, at the high end of its 25-year range since the tech bubble burst.
Stocks are also richly valued relative to bonds based on the equity risk premium (ERP). The ERP compares the earnings an investor gets at a given price level for the stock market (earnings divided by price) with the yield offered by long-term Treasuries (now about 4.5% on the 10-year). These two “yields” are about even right now, meaning investors are not getting compensated for the additional risk they are taking in equities relative to high-quality fixed income. The bar for stock valuations to expand, either through better earnings prospects or lower interest rates, is quite high. As such, if this bull market has another leg higher in it, earnings will likely be the main driver.
A Lot of Good News is Priced in With Stock Valuations High Versus Bond Yields
Equity risk premium essentially offers investors no compensation for taking on equity risk
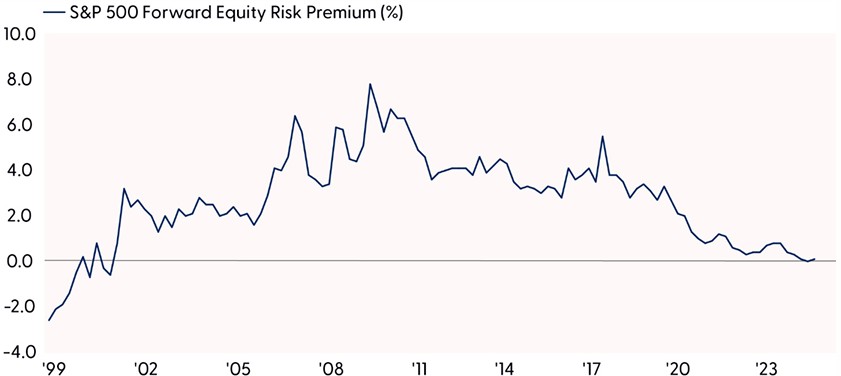
Source: LPL Research, FactSet, Refinitiv, Bloomberg 02/05/25
S&P 500 equity risk premium is the S&P 500 earnings yield (earnings divided by price) minus the US 10-year Treasury yield. Earnings represent estimates for the next 12 months. All indexes are unmanaged and cannot be invested into directly. Past performance is no guarantee of future results.
Conclusion
The bulls and bears both have good arguments for markets right now. On one side, there’s a good chance that economic growth, strong earnings, and disinflation will power stocks higher this year. Plus, the technical picture remains positive, and historical patterns such as the January Barometer add to a compelling bull case. However, the inflation battle is not over, stocks are pricing in a lot of good news, and the policy landscape is tenuous. With more tariffs and retaliation likely, alongside government spending constraints that may make it difficult to extend the Trump tax cuts from 2017, we expect modest gains in stocks over the balance of the year with more ups and downs compared to 2024.
Asset Allocation Insights
LPL’s Strategic and Tactical Asset Allocation Committee (STAAC) maintains its tactical neutral stance on equities, with a preference for the U.S., for growth over value, and benchmark-like exposure across the market capitalization spectrum. However, we do not rule out the possibility of short-term weakness as sentiment remains stretched and a lot of good news is priced into markets amidst lingering inflation, elevated trade tensions, and several geopolitical threats that are difficult to dismiss.
Within fixed income, the STAAC continues to recommend modest exposure to preferred securities as valuations remain attractive. However, the risk/reward for core bond sectors (U.S. Treasury, agency mortgage-backed securities, investment-grade corporates) is more attractive than plus sectors. The Committee does not believe adding duration is attractive at current levels, and the STAAC remains neutral relative to our benchmarks.
Important Disclosures
This material is for general information only and is not intended to provide specific advice or recommendations for any individual. There is no assurance that the views or strategies discussed are suitable for all investors or will yield positive outcomes. Investing involves risks including possible loss of principal. Any economic forecasts set forth may not develop as predicted and are subject to change.
References to markets, asset classes, and sectors are generally regarding the corresponding market index. Indexes are unmanaged statistical composites and cannot be invested into directly. Index performance is not indicative of the performance of any investment and do not reflect fees, expenses, or sales charges. All performance referenced is historical and is no guarantee of future results.
Any company names noted herein are for educational purposes only and not an indication of trading intent or a solicitation of their products or services. LPL Financial doesn’t provide research on individual equities.
All information is believed to be from reliable sources; however, LPL Financial makes no representation as to its completeness or accuracy.
All investing involves risk, including possible loss of principal.
US Treasuries may be considered “safe haven” investments but do carry some degree of risk including interest rate, credit, and market risk. Bonds are subject to market and interest rate risk if sold prior to maturity. Bond values will decline as interest rates rise and bonds are subject to availability and change in price.
The Standard & Poor’s 500 Index (S&P500) is a capitalization-weighted index of 500 stocks designed to measure performance of the broad domestic economy through changes in the aggregate market value of 500 stocks representing all major industries.
The PE ratio (price-to-earnings ratio) is a measure of the price paid for a share relative to the annual net income or profit earned by the firm per share. It is a financial ratio used for valuation: a higher PE ratio means that investors are paying more for each unit of net income, so the stock is more expensive compared to one with lower PE ratio.
Earnings per share (EPS) is the portion of a company’s profit allocated to each outstanding share of common stock. EPS serves as an indicator of a company’s profitability. Earnings per share is generally considered to be the single most important variable in determining a share’s price. It is also a major component used to calculate the price-to-earnings valuation ratio.
All index data from FactSet or Bloomberg.
This research material has been prepared by LPL Financial LLC.
Not Insured by FDIC/NCUA or Any Other Government Agency | Not Bank/Credit Union Guaranteed | Not Bank/Credit Union Deposits or Obligations | May Lose Value
For public use.
Member FINRA/SIPC.
RES-0002683-1224 Tracking # 694348 | # 694580 (Exp. 02/26)