After a tough start for stocks in 2022, investors are looking for reasons to expect a rebound. After more than doubling off the pandemic lows in March 2020, without anything more than a 5% pullback in 2021, stocks probably needed a break. That doesn’t, however, make this dip feel much more comfortable. Here we cite some reasons we don’t expect this selloff to go a lot further, though a 10% drawdown in the S&P 500 seems reasonable to expect.
Tough start to the year
It’s been a rough few weeks for the stock market. Fears of rising rates and the Federal Reserve pulling back its stimulus more aggressively than previously anticipated to fight high inflation have caused most of the market jitters, though earnings season—albeit in the very early stages—hasn’t helped either.
The pain has been particularly acute for the many growth stocks that make up the Nasdaq Composite, which has corrected 14% from its November 2021 high. This is the third worst start to a year ever for the Nasdaq (down 10% year to date), though it was positive the rest of the month the last five times it was down 5% or more year to date through January 20 (thank you to our friends at Bespoke Investment Group for that nugget).
Small caps have been hit even harder, with the Russell 2000 Index nearly in bear market territory with its 18% decline since November 8, 2021—though the higher quality S&P 600 small cap index has fared better in losing 12% during this period.
What might get this market turned around
So what might turn this market around? Stabilization in interest rates would help. The 10-year Treasury yield’s inability to break through 1.9% last week and subsequent dip below 1.8% is a good start. Stock valuations are interest rate sensitive and harder to justify if bond yields go much higher (the price-to-earnings ratio for the S&P 500 using the 2022 consensus estimate for earnings per share is currently a touch below 20).
On inflation, clearly a key risk for markets right now, the data likely won’t change much in January when it’s reported in February. However, we could soon see more evidence of easing supply chain bottlenecks and more people jumping into the workforce as COVID-19 disruptions hopefully fade (there are a near-record 10.5 million open jobs in the U.S. now compared to less than 7 million pre-pandemic in December of 2019). When the market begins to gain more confidence that inflation will start coming down, hopefully as winter turns to spring, inflation may turn from stock market detractor to a contributor. A Fed meeting this week without any negative surprises would also help. Stable or lower oil prices would help as well.
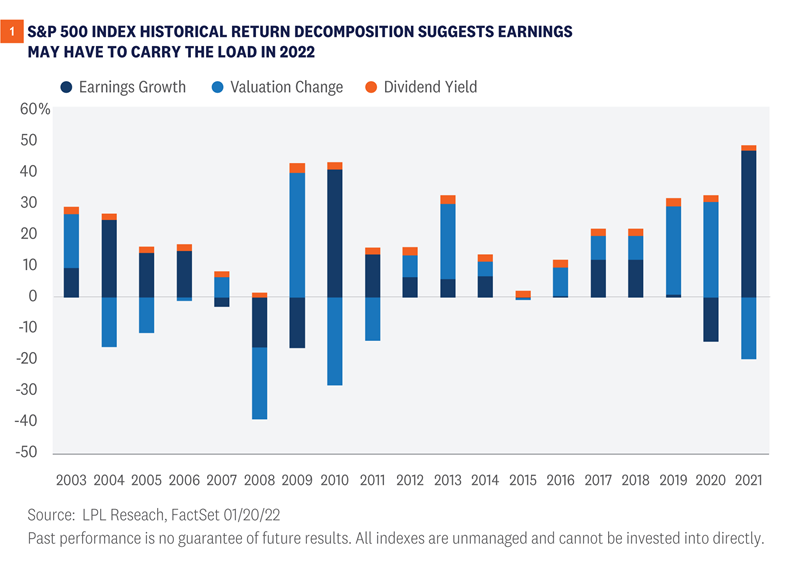
What about earnings as a potential catalyst? As we suggested in our 2022 Outlook: Passing the Baton, earnings growth would likely be the primary source of stock market gains this year. The downward pressure on stock valuations from higher interest rates makes that more likely.
In Figure 1 we have decomposed annual returns for the S&P 500 into earnings growth, valuation changes, and dividend yield. During 2019 and 2020, when the S&P 500 returned 24.7% annualized (55.7% cumulative), increases in valuations drove much of the gains. That changed last year when earnings rose an estimated 50% and valuations contracted. We expect 2022 to look more like the mid-cycle mid-2000s or mid-2010s with more modest returns, more contributions from earnings growth and dividends, and little, if any, contribution from valuation.
That begs the question whether corporate America has enough earnings power still left in the tank to get investors excited about buying this latest dip. We wrote about the challenges facing corporate America this earnings season in our earnings preview, including supply chain disruptions, wage and other cost pressures, and the Omicron COVID-19 variant, all of which make it tough to predict if earnings season will be a catalyst for a turnaround.
Still, we lean toward the rest of earnings season providing some support for stocks for these reasons:
- Despite these challenges, with about 70 S&P 500 constituents having reported, index earnings are still tracking to 5% upside, in line with the long-term historical average.
- Profit margin assumptions baked into analysts’ estimates appear to reflect these challenges, increasing the likelihood of mostly positive market reactions to results.
- Despite a likely smaller upside surprise than in recent quarters, an earnings growth rate potentially in the mid-to-high 20s for the quarter is still impressive.
- Estimates for 2022 have been holding up well. Historically, earnings estimates fall during reporting season, which isn’t happening so far.
Volatility is uncomfortable but normal
Investors have grown accustomed to steady, consistent gains over the past couple of years which makes the current bumpy ride feel more uncomfortable. After no more than a 5% pullback in 2021 and the S&P 500 having more than doubled off the March 2020 lows, we have been anticipating more volatility in 2022. Higher interest rates and less accommodating monetary policy from the Fed amid stubbornly high inflation are getting most of the blame, and probably deservedly so.
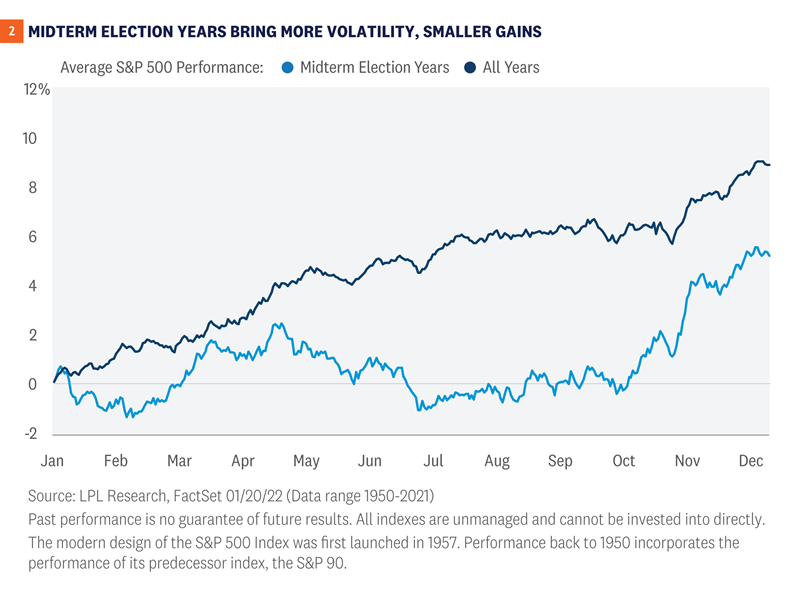
But another reason for the rough start to the year could be policy driven. It is a midterm election year, which typically brings more volatility and smaller gains. As shown in Figure 2, historically during mid-term years the S&P 500 has on average done nothing but bounce around the flat line until right before midterm elections, much different than the average path of the market across all years.
Although we would argue these midterms may bring less uncertainty than some others in recent decades given gridlock appears more likely than not to most political strategists, policy uncertainty is still there and the environment remains divisive. As a result, we would not be surprised if this year ended up looking more like the typical midterm year with mid-single-digit gains for stocks rather than double-digit gains, and a better second half than first half. It will take time for the biggest clouds to clear (COVID-19 and inflation) and stocks have historically seen very strong rallies after midterm elections pass.
Conclusion
This volatility we’ve seen this year is uncomfortable, but it is well within the range of normal based on history. The S&P 500 has averaged three pullbacks of 5% or more per year and one correction of at least 10% per year over its long history. After just one 5% dip last year, and huge gains off the 2020 lows, we were due for a dip.
This pullback in the S&P 500 could easily go to 10%, or even a little more. The average max drawdown in a positive year for stocks is 11%. But based on the still solid overall economic and earnings backdrop, our expectation that the inflation clouds may soon start to clear, and the stock market’s historically solid track record early in Fed rate hike cycles, we wouldn’t expect this pullback to go much further. We continue to see fair value on the S&P 500 at year end at 5,000-5,100, more than 12% above Friday’s closing price at the low end.
Click here to download a PDF of this report.
______________________________________________________________________________________________
IMPORTANT DISCLOSURES
This material is for general information only and is not intended to provide specific advice or recommendations for any individual. There is no assurance that the views or strategies discussed are suitable for all investors or will yield positive outcomes. Investing involves risks including possible loss of principal. Any economic forecasts set forth may not develop as predicted and are subject to change.
References to markets, asset classes, and sectors are generally regarding the corresponding market index. Indexes are unmanaged statistical composites and cannot be invested into directly. Index performance is not indicative of the performance of any investment and does not reflect fees, expenses, or sales charges. All performance referenced is historical and is no guarantee of future results.
Any company names noted herein are for educational purposes only and not an indication of trading intent or a solicitation of their products or services. LPL Financial doesn’t provide research on individual equities.
All information is believed to be from reliable sources; however, LPL Financial makes no representation as to its completeness or accuracy.
U.S. Treasuries may be considered “safe haven” investments but do carry some degree of risk including interest rate, credit, and market risk. Bonds are subject to market and interest rate risk if sold prior to maturity. Bond values will decline as interest rates rise and bonds are subject to availability and change in price.
The Standard & Poor’s 500 Index (S&P500) is a capitalization-weighted index of 500 stocks designed to measure performance of the broad domestic economy through changes in the aggregate market value of 500 stocks representing all major industries.
The PE ratio (price-to-earnings ratio) is a measure of the price paid for a share relative to the annual net income or profit earned by the firm per share. It is a financial ratio used for valuation: a higher PE ratio means that investors are paying more for each unit of net income, so the stock is more expensive compared to one with lower PE ratio.
Earnings per share (EPS) is the portion of a company’s profit allocated to each outstanding share of common stock. EPS serves as an indicator of a company’s profitability. Earnings per share is generally considered to be the single most important variable in determining a share’s price. It is also a major component used to calculate the price-to-earnings valuation ratio.
All index data from FactSet.
This research material has been prepared by LPL Financial LLC.
Securities and advisory services offered through LPL Financial (LPL), a registered investment advisor and broker-dealer (member FINRA/SIPC). Insurance products are offered through LPL or its licensed affiliates. To the extent you are receiving investment advice from a separately registered independent investment advisor that is not an LPL affiliate, please note LPL makes no representation with respect to such entity.
Not Insured by FDIC/NCUA or Any Other Government Agency | Not Bank/Credit Union Guaranteed | Not Bank/Credit Union Deposits or Obligations | May Lose Value
RES-1013950-0122 | For Public Use | Tracking # 1-05235161 (Exp. 1/23)