The softer tone toward China from the White House, President Trump’s pledge not to fire Federal Reserve (Fed) Chair Jerome (Jay) Powell, and renewed optimism about Fed rate cuts all helped drive a strong market rebound last week. The latest advance, while encouraging, raises the bar for additional near-term gains. While LPL Research still has confidence that these trade issues will be resolved and suggests long-term investors stay the course, we would urge patience for those trying to be nimble and tactical. No trade deals, or even frameworks for deals, have been announced yet, corporate America has little visibility, and stocks are expensive for an inflationary environment. Our recently adjusted year-end fair value S&P 500 target of 5,650–5,800 only allows for 5% upside above Friday’s close. We stay neutral on equities tactically for now.
Some Reassuring Words on China from the White House
Treasury Secretary Scott Bessent said last week that tariffs on China will likely come down because these high levels are not sustainable. We agree. The Trump administration hasn’t taken any action yet, and high-level talks with President Xi have not been agreed to yet, but Trump’s tone notably softened last week. He indicated tariffs on Chinese imports would come down substantially (but not to zero), and that he would be “very nice” to China. We’ll see what that means, but the conciliatory tone was enough to add fuel to the market recovery. It appears recent market volatility shaped the communications from the White House (the so-called “Trump put”).
The reassurance, along with Trump’s statement that he is not looking to fire Powell, drove a 7% bounce in the S&P 500 Tuesday through Friday of last week. But following the latest rebound, the index is stuck between its 50-day moving average (dma) (around 5,640) and the April intra-day low of around 4,835.
At Friday’s close (5,525), the index was just 2% below the 50-day, and less than 4% below the 200-day, but 11% above the April lows, creating a short-term risk-reward trade-off tilted a bit toward the downside based on technical analysis. The 4,800–4,835 area is key for the S&P 500 to hold to maintain the long-term uptrend. Upside hurdles for the index below the 50-dma include the 20-dma around 5,364 and the 5,491–5,505 range.
S&P 500 Is Stuck in Technical No-Man’s Land
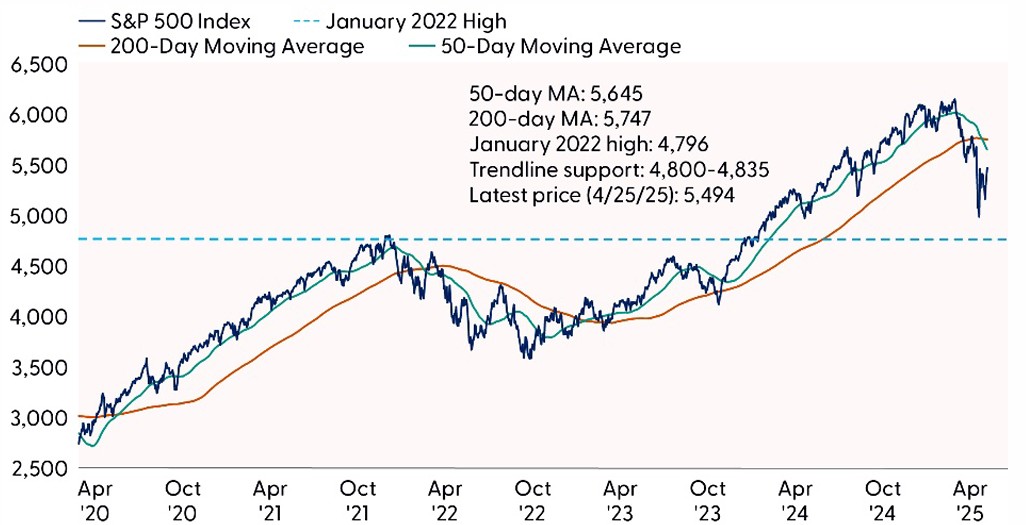
Source: LPL Research, FactSet, 04/24/25
Disclosures: Indexes are unmanaged and cannot be invested in directly. Past performance is no guarantee of future results.
Earnings Adjustment Still in Process Amid Limited Visibility
Earnings season is well underway with over one-third of S&P 500 companies having reported. While most companies have beaten first quarter estimates so far (74% to be precise, which is slightly below average), what’s different is the challenge that tariffs present companies when giving guidance. Still, the numbers are quite good so far with S&P 500 earnings per share (EPS) growth tracking to a solid 10% year-over-year increase.
It’s no surprise that estimates for the rest of this year have come down since companies started to report. The consensus S&P 500 EPS estimate for 2025 now sits at $264, down from roughly $269 at quarter end despite the Q1 upside. Expect that number to keep coming down as more results stream in. Even if tariff rates get cut in half from current levels (from mid 20s to low teens), which we think is reasonable, a slowing economy will make $260 very difficult to achieve (our recently lowered estimate is a range of $250 to $255). Getting estimates down to a more credible level helps increase the chances that stocks have established a durable low.
Alphabet (GOOG/L) kicked off earnings for the big artificial intelligence (AI) spenders on Thursday and delivered solid results. Perhaps most importantly, the company reiterated its $75 billion capital expenditures (capex) guidance for this year, increasing the chances its peers will follow suit despite tariffs. Markets expect a hit to corporate confidence from trade uncertainty that curbs capex. The AI players can help clear some of that fog, so next week’s capex guidance from Amazon (AMZN), Meta (META), and Microsoft (MSFT) will be key.
Corporate America Has Little Earnings Visibility Given Trade Uncertainty
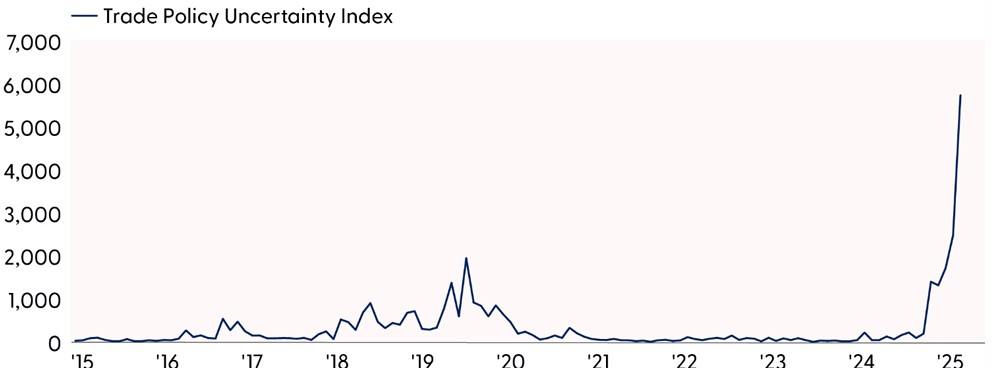
Source: LPL Research, Bloomberg, Baker, Bloom & Davis, 04/25/25
Disclosures: Indexes are unmanaged and cannot be invested in directly. The Trade Policy Uncertainty Index measures news reports of uncertainty related to trade.
Past performance is no guarantee of future results.
Stock Valuations Are High for This Inflation Environment
High valuations are another reason we suggest investors be careful and not take on too much risk. As shown in the “High Inflation Tends to Pressure Stock Valuations” chart, higher inflation tends to be accompanied by lower valuations, and vice versa. Based on this analysis, a 4% inflation rate, which is where high tariffs could potentially take us, would imply a price-to-earnings ratio (P/E) of around 16 times trailing earnings. With the trailing P/E currently at 23, that suggests hefty downside risk. Even as a bear case, we think that’s too bearish.
Two big caveats here. One, for the current level of profitability and capital efficiency, valuations should be higher than they have been historically. And second, even if tariffs take inflation up to 4%, it will likely be temporary. The market will see through it. Tariffs are a one-time price adjustment. So, don’t take this analysis literally, but just keep in mind that elevated inflation will make it more difficult for stocks to produce substantial upside over the balance of the year unless tariffs come way down, sparking earnings upside.
High Inflation Tends to Pressure Stock Valuations
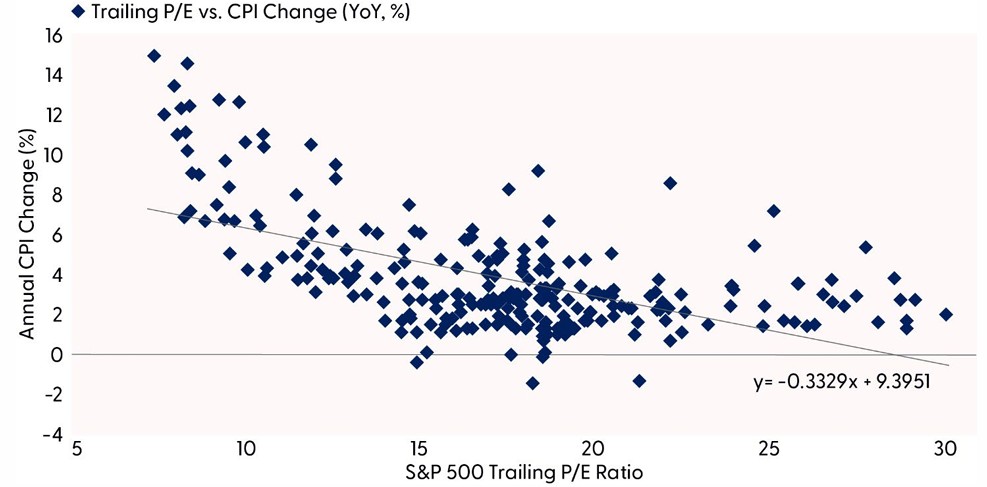
Source: LPL Research, FactSet, 04/24/25 (data from 1962 to present)
All indexes are unmanaged and cannot be invested in directly. Past performance is no guarantee of future results.
Conclusion
A softer tone on China from the White House is encouraging, as is the assurance that President Trump won’t fire Fed Chair Powell. But last week’s rebound in stocks raises the bar, elevating valuations when corporate America has poor earnings visibility. We still have confidence that these trade issues will be resolved, but the ultimate landing spot for tariffs remains uncertain. No trade deals, or even frameworks, have been announced yet. Bottom line, we are staying neutral on equities tactically for now as the risk-reward trade-off in the short-term is not very attractive and we cannot dismiss the chances of a reversal lower in the coming weeks. The “Trump put” that was evident two weeks ago, the amount of investor fear at the April lows, and technical analysis trends do increase the likelihood that sell-offs below 5,000 on the S&P 500 will be bought.
Asset Allocation Insights
LPL’s Strategic and Tactical Asset Allocation Committee (STAAC) maintains its tactical neutral stance on equities, with a preference for the U.S. over emerging markets, growth over value, and large caps over small. After the latest stock market rebound, the Committee has not ruled out the possibility of a reversal lower due to trade uncertainty and slowing economic growth. LPL Research continues to monitor tariff news, economic data, earnings, the bond market, and various technical indicators to identify a potentially attractive entry point to add equities.
Within fixed income, the STAAC holds a neutral weight in core bonds, with a slight preference for mortgage-backed securities (MBS) over investment-grade corporates. In our view, the risk-reward for core bond sectors (U.S. Treasury, agency MBS, investment-grade corporates) is more attractive than plus sectors. We believe adding duration isn’t attractive at current levels, and the STAAC remains neutral relative to our benchmarks.
Important Disclosures
This material is for general information only and is not intended to provide specific advice or recommendations for any individual. There is no assurance that the views or strategies discussed are suitable for all investors or will yield positive outcomes. Investing involves risks including possible loss of principal. Any economic forecasts set forth may not develop as predicted and are subject to change.
References to markets, asset classes, and sectors are generally regarding the corresponding market index. Indexes are unmanaged statistical composites and cannot be invested into directly. Index performance is not indicative of the performance of any investment and do not reflect fees, expenses, or sales charges. All performance referenced is historical and is no guarantee of future results.
Any company names noted herein are for educational purposes only and not an indication of trading intent or a solicitation of their products or services. LPL Financial doesn’t provide research on individual equities.
All information is believed to be from reliable sources; however, LPL Financial makes no representation as to its completeness or accuracy.
All investing involves risk, including possible loss of principal.
US Treasuries may be considered “safe haven” investments but do carry some degree of risk including interest rate, credit, and market risk. Bonds are subject to market and interest rate risk if sold prior to maturity. Bond values will decline as interest rates rise and bonds are subject to availability and change in price.
The Standard & Poor’s 500 Index (S&P500) is a capitalization-weighted index of 500 stocks designed to measure performance of the broad domestic economy through changes in the aggregate market value of 500 stocks representing all major industries.
The PE ratio (price-to-earnings ratio) is a measure of the price paid for a share relative to the annual net income or profit earned by the firm per share. It is a financial ratio used for valuation: a higher PE ratio means that investors are paying more for each unit of net income, so the stock is more expensive compared to one with lower PE ratio.
Earnings per share (EPS) is the portion of a company’s profit allocated to each outstanding share of common stock. EPS serves as an indicator of a company’s profitability. Earnings per share is generally considered to be the single most important variable in determining a share’s price. It is also a major component used to calculate the price-to-earnings valuation ratio.
All index data from FactSet or Bloomberg.
This research material has been prepared by LPL Financial LLC.
Not Insured by FDIC/NCUA or Any Other Government Agency | Not Bank/Credit Union Guaranteed | Not Bank/Credit Union Deposits or Obligations | May Lose Value
For public use.
Member FINRA/SIPC.
RES-0003761-0325 Tracking #730788 | #730789 (Exp. 04/26)